
Beware of chewing!
A graph of complex construction
The algorithm that interprets the acquisitions concerning the dynamic chewing processes gives rise to an elliptic figure of Lissajous that is represented on a Cartesian graph. In this graph the X axis represents the differential activity of the masseters (right masseter minus left masseter) while the Y axis represents the differential activity of the anterior temporal (right anterior temporal less left anterior temporal).
Thus, during a single masticatory act, a single point is generated whose spatial coordinates X and Y will depend on the temporal-masseteric differential values specific for that act. This operation is repeated for each chewing act thus obtaining a cloud of identification points of the patient's chewing dynamics.
Then, two ellipses are generated, representing the populations of points obtained by the acquisitions of the chewing acts. One to identify those relating to chewing on the right side (green color) and one for the left side (red color). Therefore, the chewing protocol found in the ellipsis diagrams on a Cartesian plane a natural representation.
Example
The patient has chewed on the right side with the following recruitment ratios (all values refer to the standardization test carried out on the cottons):
- Right Masseter: 85% Left Masseter: 30%
- Right thunderstorm: 110% Left thunderstorm: 45%
The right-left differential for muscle pairs will therefore be:
- Masseter differentials = 85 - 30 = 55%
- Time differentials = 110 - 45 = 65%
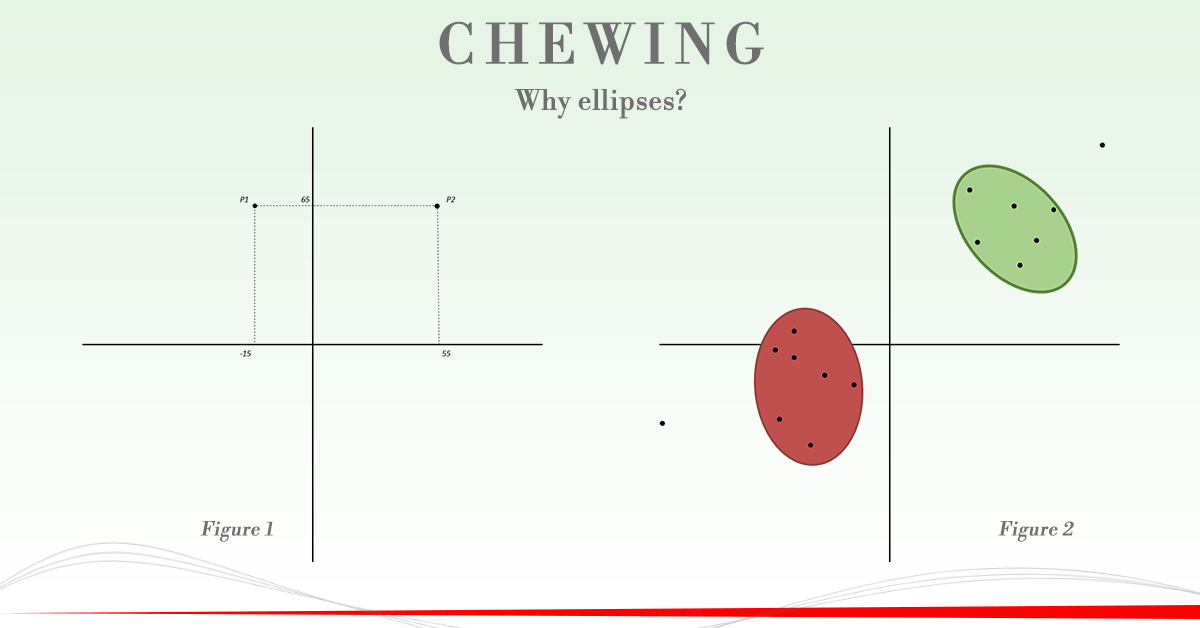
The point identifies a single masticatory act and it will have coordinates X-Y P2 (55; 65). Having both positive coordinates will be placed in the first quadrant (top right), as in Figure 1.
Let us now consider another point, again with reference to the chewing on the right side.
- Right Masseter: 25% Left Masseter: 40%
- Right thunderstorm: 110% Left thunderstorm: 45%
In this case the right-left differential for muscle pairs will be:
- Masseter differentials = 25 - 40 = -15%
- Time differentials = 110 - 45 = 65%
The point that identifies this chewing instead will have coordinates X-Y P1 (-15; 65). This will place it in the second quadrant (top left), due to the negativity of the X coordinate, as shown in Figure 1. This example, unlike the previous one, illustrates an anomalous situation during which, although the patient is chewing on the right side, the balancing masseter (left) is more recruited with respect to the working masseter (right).
This process is carried out for all the chewing acts that follow each other during a chewing on one side. At the end of the acquisition process our chart will then be dotted with points, some belonging to the chewing on the right side and others to the one on the left side. An interpolation algorithm will take care of generating the ellipses around the points of each specific chewing, as shown in Figure 2.
Brief overview of the indices in play
In this Cartesian graph the position of the ellipses in the different quadrants does not find an anatomical correspondent in the patient. As might be mistakenly thought, the various quadrants do not in fact represent the various muscular districts (masseters below and temporal above) but are the regions of space in which the various points will be positioned.
We will not analyze if the position in which the points are found is physiologically correct or not in this article. Therefore, to understand if the ellipses are in physiologically correct positions it is useful to briefly introduce the main reference indices. To better understand the interpretation of these indices, refer to the appropriate articles on this blog:
- Modulus
The module is represented graphically by the distance of the center of the ellipse from the center of the Cartesian axes.
- Acrophase
The acrophase is the angle between the straight line connecting the center of the ellipse with the center of the axes and the X axis.
- Ellipse Area
The area of the ellipse indicates the area within which the center of gravity of all the chews is located and in which most of the points are collected.