PRINCIPLE

Dental occlusion does not cause physiological alterations to the recruitment of the masticatory muscles

APPLICATIONS

A coordinated chewing improves reliability and comfort of dental treatments

TOOL

An electromyography modern for a diagnosis of masticatory muscles simple and reliable

evolves Freely (de Götzen Srl), first instrument specifically designed for analysis instrumental efficient masticatory muscle
(marketed by TFR Technology Srl for de Götzen Srl since 2004). The parameters generated by are validated by all the most renowned international scientific journals and used for diagnostic purposes and scientific research at universities in Europe, America and Asia. is marketed exclusively by TFR Technology Srl, a company founded in 2003 by professionals working in the dental environment to disseminate materials and methods developed by the University Research Italian. More than ten years of experience allow us today to offer a reliable and effective cultural support.

OVERVIEW

For more information, click on the numbers highlighted in green in the panel below.

1
2
3
4
5
6
7
8
9
1

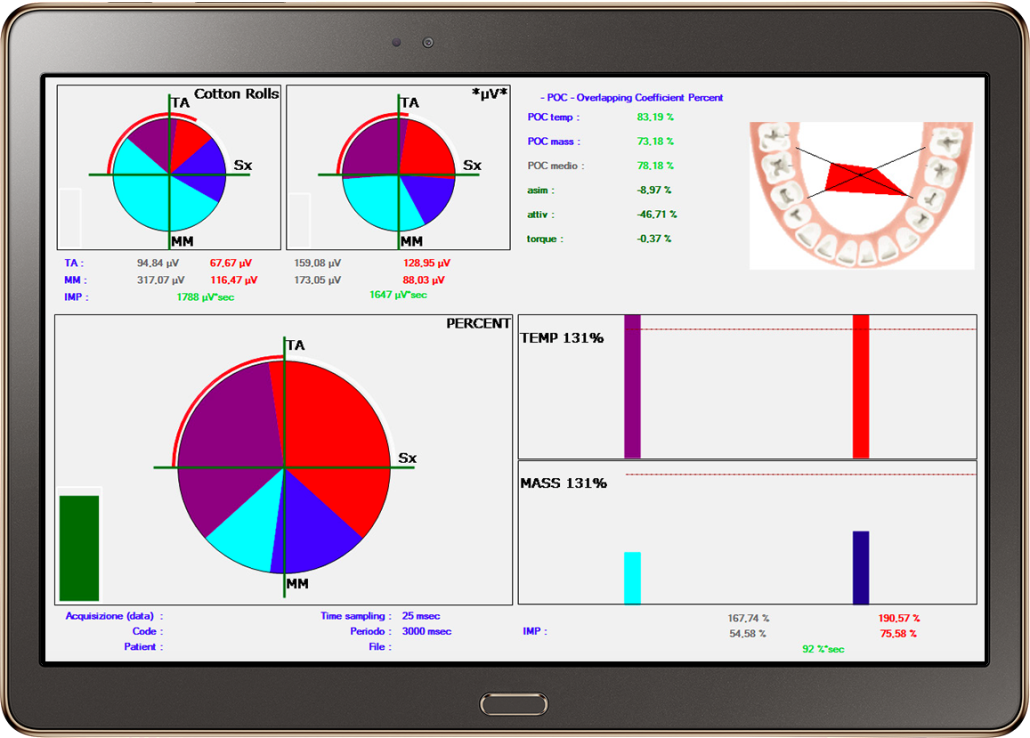
Cotton Rolls pie Chart:
It visualizes graphically the data related to standardized acquisition made with cotton rolls between the arches (with reduced dento-parodontal proprioception). The violet slice indicates the right Temporal activity, the red one indicates the left Temporal activity, blue and light blue respectively left and right Masseter.

2

*μV* pie Chart:
it visualizes graphically the data concerning the acquisition made with teeth in contact (or with prosthesis, occlusal splint, occlusal increase, ect.).

3

Percent pie Chart:
It visualizes a chart resulted from the sovrapposition of Cotton Rolls pie and *μV* pie Chart and expresses the differential standardized activity caused by dental proprioception; in a patient where all four muscles are influenced by dental proprioception in the same quantity, this pie has the equal four slices. In this case, the right Masseter muscle is the more influenced.

4

The Percentage Overlapping Coefficient (POC) indicates , in percentage, how much the influence of dental contact in the left muscles compared to the right one is similar. An hypothetical POC of 100% individuates two muscles that are influenced in the same quantity by dental contact. The two muscles could be both inhibited by dental contact at 50% (Impact 50%), obtaining an hypothetical POC of 100%.
The 95% of healthy subjects have a POC values comprised among 80% and 90%.

5

Asim compares the influence of dental contact on total activity of right antimere (right Temporal and Masseter) compared to left Temporal and Masseter. This value substantially indicates how much right muscles compared to left ones are influenced by dental contact.
A positive index shows a prevalence of right muscles. Vice versa, a negative one indicates a greater differential activity of left antimere. The 95% of healthy subjects have an Asymmetry values comprised among + 10.

6

Attiv index compared the influence of dental contact on the Temporals activity compared to the Masseters one.
A negative index indicates a greater differential activity of Temporal muscles (anterior barycentre). A positive index shows a prevalence of Masseters muscles. The 95% of healthy subjects have an Attiv values among + 10%.

7

Torque index measures the differential activity of right Temporal and left Masseter compared with the antagonist couple.
A prevalence of right Temporal and left Masseter muscles can produce torcent forces on the mandible with a latero-deviating to the right; in this case the torque index will be positive.
A prevalence of left Temporal and right Masseter will be shown by a negative Torque index, indicating torcent forces to the left.
The 95% of healthy subjects have Torque values among + 10%.

8

This chart shows in which occlusal areas we have the activity of the more unbalanced muscle/s.
When he chart is green the disagreement from normality is low, orange with values very different from normality but with possible occlusal origin. In case of red chart, the values are really different from normal ones, suggesting a possible technical error and/or a problem without an occlusal origin.

9

Trough a bar chart, the Impact index represents the electrical activity that each muscle has expressed during the maximum voluntary clench test as percentage of the activity expressed on the cotton rolls.
Healthy subjects are able to express from 80% to 120% of the activity produced on cottons. Lower values indicates a proprioceptive inhibition caused by dental contact.