
MODULUS: how much does the balancing side have to work to protect the joints during chewing?
MODULUS: how much does the balancing side have to work to protect the joints during chewing?
Definition
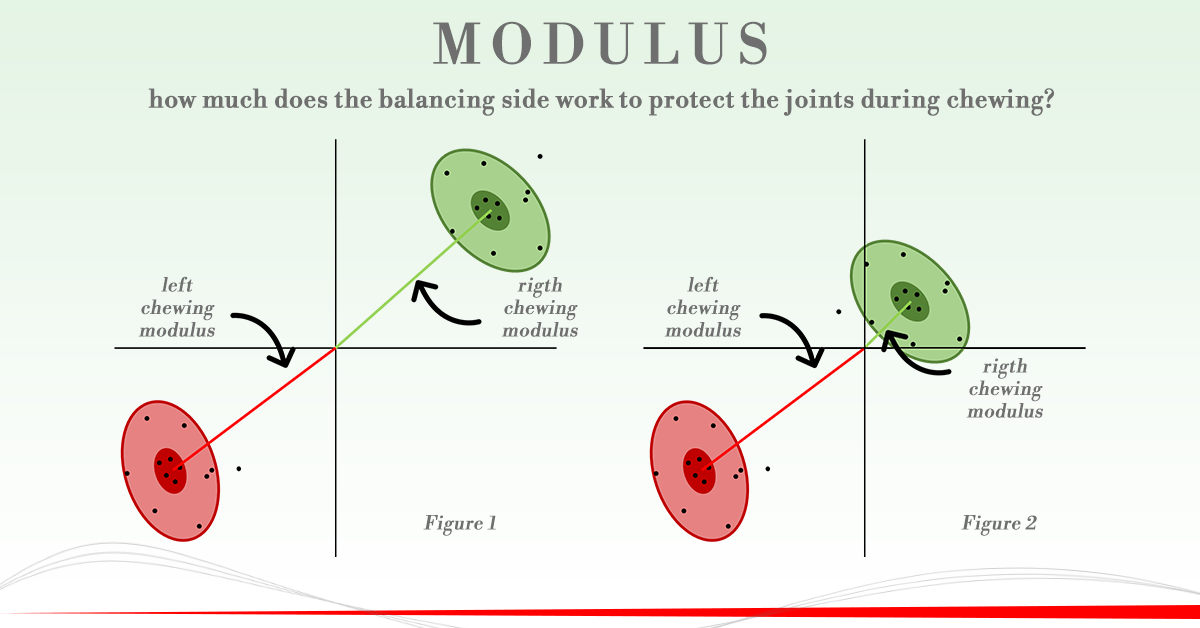
The modulus is represented graphically by the distance of the center of the ellipse from the center of the Cartesian axes (red and green lines). This means that the greater this value is (and therefore the more far from the center the ellipse is located) the greater is the differential between the two pairs of muscles during a chewing test on one side. It helps to understand if chewing involves more the working antimer than the balancing one.
In normal situations it has an average value of 90.
Example
Consider the graphs in Figure 1 and Figure 2, where the ellipses are positioned within the quadrants in which they are expected to be in normal conditions.
We can see that the ellipse on the right chewing (green) is found in both graphs in the first quadrant: in a case very far from the center, in the other very close.
In accordance with what is said in the article "Beware of chewing!", already available in this blog, the right-left muscle activation differential for the two pairs of muscles (green line) is, in both configurations, in favor of the entire right antimer (right masseter> left masseter, right anterior temporal> left anterior temporal).
In the first case, however, the module is very high (elongated line) while in the second it is very low (short line):
- in the first case, the right chewing involved the working side more than the balancing one in a clear way.
- in the second case instead the right chewing involved the balancing side almost as much as the working side.
These two graphs, apparently analogous for the positioning of the ellipses, describe two different situations regarding the right chewing: one in which the patient has developed a strong differentiation of muscle recruitment between the two antimers and one in which there is no specific pattern of recruitment.
For completeness of analysis instead the left chewed (red) is located at the bottom left in the third quadrant in both examples. Also in this case the left-right muscle activation differential for the two pairs of muscles is very high (elongated red line) and also in this case the working side has worked more than the balancing side
Conclusions
These examples make us understand that the value of the modulus is therefore an index of how much high or low the muscular activation differential of the two muscle pairs is (balancing side vs. working side) but does not provide indications on where the balance is between the 4 muscles investigated during dynamic chewing. In fact, we may have cases in which the ellipses are not positioned in a physiologically correct way (quadrants different from those expected under normal conditions). For this reason it is necessary to integrate also the Acrofase index during the interpretation of this graph, to understand if the positioning of the ellipses respects what we would expect in normal conditions.