
What means to normalize
In math
Normalizing means expressing a value as a percentage of another value considered as reference. In this way the normalized data result most comparable with each other as they are related to a common measure.
In surface electromyography
Normalizing an electromyographic measurement means detecting the electrical activity generated during the contraction of a muscle in a particular condition. Usually this condition must be highly repeatable and easy to perform such as a maximum static (isometric) contraction. Assuming the hypothesis that a muscle in maximum static contraction makes an effort equal to 100% of its ceiling, the electric activity (normalized) produced during any other exercise will indicate the necessary effort to perform the gesture under examination.
This general procedure can be applied to each individual muscular district that could be investigated by superficial electromyography, and it is possible to identify the maximal strain of each muscle by thinking of a specific test of maximum static contraction for that given muscle.
In clinical practice
When analyzing the electrical activity of several muscle groups simultaneously, the pure values of these individual measurements will be proportional to the specific contraction force of each muscle. Absolute measurements of this type do not provide information on how much each muscle has been involved compared to its maximal contraction.
Example
We want to evaluate the activity of 3 muscles during a contraction exercise and how much each muscle is involved:
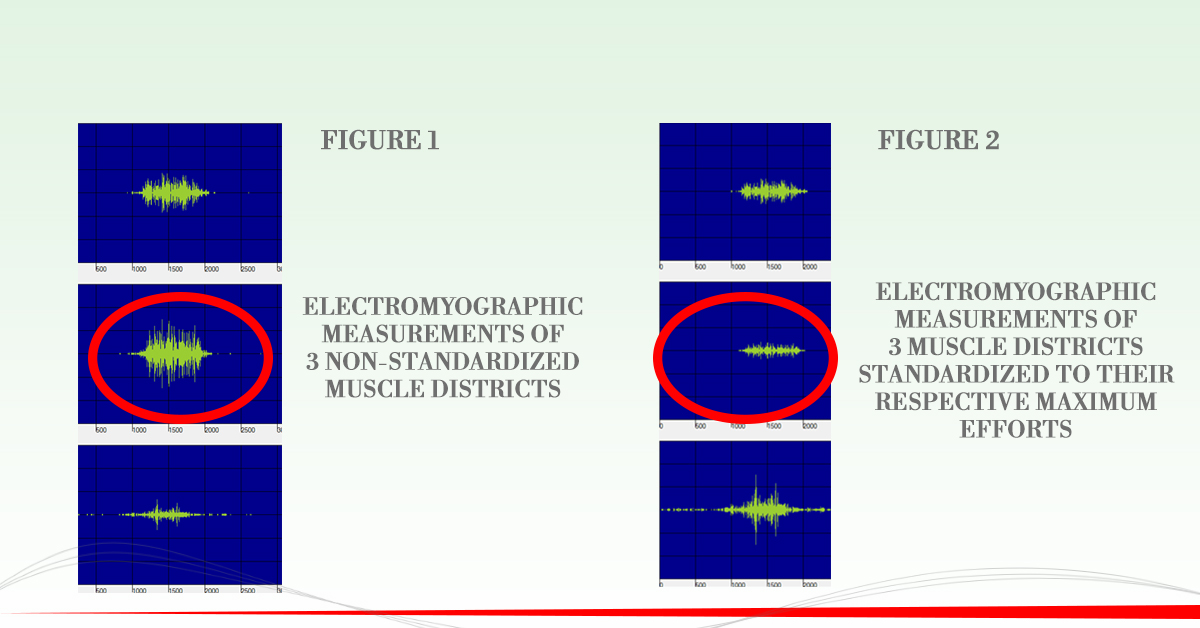
- In Figure 1 it is possible to notice the pure electric activity of these 3 different muscles. The values recorded are proportional to the intensity with which those muscles contracted to perform a particular exercise. From these graphs we can see how much electric activity is able to generate a specific muscle during a specific action. Therefore, in the given conditions, the force relationships between the three muscles see the muscle highlighted by the circle as the “winner”, as it results to be the one that has generated a greater electrical activity.
- Figure 2 shows the same electrical activities of the 3 previously mentioned muscles. In this case the values were normalized with respect to the maximal effort of each muscle. This means that the graphs with the highest values will belong to the muscles that have been most involved with respect to their massive intrinsic contraction activity (regardless of their mass and therefore capacity to generate electrical voltage!). The first thing that can be noticed is that the force relationships have changed, and now the muscle highlighted by the circle appears to be the one minimally recruited during the contraction exercise.
Concluding then, both series of graphs provide useful information:
- If we want to identify the order and duration of activation we can refer to the pure values (Figure 1)
- If, on the other hand, we want to understand how much a muscle is engaged with respect to its maximum contraction capacity, it will be necessary to analyze the normalized values (Figure 2).
Ultimately, it can be stated that although the muscle highlighted by the circle, due to its specific characteristics of strength, was able to generate greater electrical activity, in reality it turned out to be the one least involved in terms of recruitment.